GoHighLevel Client Snapshot Templates: Complete Setup Guide (2026)
Your agency just landed a new client. They sign into their GoHighLevel account and see… a generic CRM dashboard. Not impressive.
What if instead, they saw a branded Client Snapshot — a custom dashboard showing their metrics (leads captured this week, conversion rate, revenue generated, SMS engagement) in a sleek, professional report? That dashboard is their first touchpoint with your agency every time they log in.
Client Snapshots are GoHighLevel’s secret weapon for white-label agencies. They’re pre-built dashboard templates you customize with your branding, client metrics, and strategic insights. In 15 minutes, you go from generic CRM to “Wow, this agency really understands my business.”
This guide walks you through building, customizing, and deploying Client Snapshot templates for your white-label clients. By the end, you’ll have 3-5 reusable templates ready to impress clients and reduce your support load (clients see answers before they ask).
Key Takeaways
- Client Snapshots are customizable white-label dashboards showing client metrics (leads, conversions, revenue) at login; available in GoHighLevel Pro and Unlimited plans
- A well-designed snapshot includes 5–7 widgets: key metrics (lead count, conversion %), visual charts (bar, pie, line), client ROI, and a monthly summary callout
- Building a snapshot takes 15–20 minutes per template; reusing templates across 10+ clients saves 20–30 hours/month in manual reporting and client support
- Best practices include: metric-first layout, color-coded KPIs, client logo placement, and a “30-day trend” chart; avoid cluttered snapshots (max 7 widgets per view)
- White-label agencies using snapshots report 40–60% reduction in “Can you send me a report?” emails and improved client retention (clients see value weekly)
What Are Client Snapshots? (And Why They Matter)
A Client Snapshot is a customizable dashboard that appears when a client logs into their GoHighLevel account. It’s a single-screen overview of their most important metrics, branded with your agency logo and color scheme.
Example: Real Estate Agent Using GoHighLevel
An agent logs in and immediately sees:
┌─────────────────────────────────────────────────────────────┐
│  🏠 [Agency Logo] Real Estate CRM Dashboard                   │
│─────────────────────────────────────────────────────────────│
│                                                               │
│  📊 THIS WEEK'S PERFORMANCE                                   │
│  ┌──────────────────────────────────────────────────────────┐
│  │ New Leads:  45  ↑ 12% vs. last week                       │
│  │ Conversions: 8  (17.8% conversion rate)                   │
│  │ Revenue:    $36,000 (estimated)                           │
│  │ SMS Engagement: 67% open rate                             │
│  └──────────────────────────────────────────────────────────┘
│
│  📈 30-DAY LEAD TREND                                         │
│  ┌────────────────────────────────────────────────────────┐  │
│  │ L │                                                       │  │
│  │ e │    ╱╲      ╱╲      ╱╲                                 │  │
│  │ a │   ╱  ╲    ╱  ╲    ╱  ╲                                │  │
│  │ d │  ╱    ╲  ╱    ╲  ╱    ╲  (45 leads this week)         │  │
│  │ s │ ╱      ╲╱      ╲╱      ╲                              │  │
│  │   ├─────────────────────────────────────────────────────┤  │
│  │   │ Week 1  Week 2  Week 3  Week 4  This Week             │  │
│  └────────────────────────────────────────────────────────┘  │
│
│  🎯 CONVERSION FUNNEL (30-Day)                               │
│  ┌──────────────────────────────────────────────────────────┐
│  │ Leads Captured:     450 (100%)                            │
│  │ Qualified:          180 (40%)                             │
│  │ Showed Property:    125 (27.8%)                           │
│  │ Offers Made:         28 (6.2%)                            │
│  │ Closed:              8  (1.78%)                           │
│  └──────────────────────────────────────────────────────────┘
│
│  💡 INSIGHT: Your SMS open rate is 67%. Try follow-up calls  │
│     for leads that don't respond to SMS (estimated +15 deals).
│
└─────────────────────────────────────────────────────────────┘
This snapshot replaces 5–10 separate reports or emails. The agent logs in, sees performance at a glance, and knows exactly what to focus on. Meanwhile, you (the agency) save 30 minutes per client per week in report-generation time.
Why Client Snapshots Matter for Agencies
Problem 1: Client Support Overhead
Without snapshots:
- Client emails: “Hey, how many leads did we get this week?”
- You dig through GoHighLevel, export data, build a one-off report
- Time per report: 20–30 minutes × 3–5 clients/day = 2–3 hours/day wasted
With snapshots:
- Client logs in, sees snapshot immediately
- No email needed
- Time saved: 2–3 hours/day per account manager
Problem 2: Client Retention
Clients stay with agencies they feel connected to. Snapshots build that connection:
- Weekly email saying “You got 50 leads this week”? Generic.
- A branded dashboard showing performance at login? Professional.
- Result: 40–60% fewer “Should I switch agencies?” conversations.
Problem 3: Competitive Advantage
Competitors use generic CRM dashboards. You use white-label snapshots branded with your logo and color scheme. Client perception: “This agency is invested in our success.”
Client Snapshot Anatomy: What Goes Where
A well-designed snapshot contains 5–7 widgets arranged strategically:
Zone 1: Header (Identity & Period)
[Your Agency Logo] Client Name: ACME Real Estate | Period: June 1–18, 2026- Your agency logo (top left, builds brand awareness every login)
- Client name (top center, confirms they’re in the right account)
- Date range (top right, “as of today” makes it feel fresh)
Zone 2: Key Performance Indicators (KPIs) — Above the Fold
┌─────────────────────────────────────────┐
│ 📊 New Leads    │ 📞 Calls Made   │ 💰 Revenue  │
│    45 ↑ 12%     │   23 ↑ 8%       │   $36K ↑ 5% │
│ vs. last week   │ vs. last week   │ vs. last wk │
└─────────────────────────────────────────┘- Max 3–4 KPIs (what matters most to your client)
- Include trend arrows (↑ ↓) for quick visual assessment
- Color-code: green = good, yellow = caution, red = action needed
- Rule: A client should understand their performance in 5 seconds
Zone 3: Primary Chart (Lead Trend, Conversion Funnel, or Revenue)
30-DAY LEAD TREND (Primary insight)- 1 large chart showing the most important trend
- Line, bar, or area chart (avoid pie charts; they don’t show trends)
- Y-axis: lead count, conversions, or revenue
- X-axis: last 30 days (weekly breakdown preferred)
- Purpose: Show momentum (are we trending up or down?)
Zone 4: Secondary Chart (Breakdown or Comparison)
CONVERSION FUNNEL (WHERE LEADS ARE GETTING STUCK)- Funnel chart showing lead → qualified → proposal → closed
- Or: channel breakdown (website forms vs. phone vs. referral)
- Purpose: Identify bottlenecks and opportunities
Zone 5: Engagement Metrics (SMS/Email Performance)
COMMUNICATION METRICS (30-DAY)
├─ SMS Open Rate: 67%
├─ Email Open Rate: 42%
└─ Reply Rate: 18%- Shows client how well their messaging is working
- Benchmarked against industry (optional but impressive)
- Purpose: Proof that automation is working
Zone 6: Insight or Callout (Optional but Impactful)
💡 INSIGHT: Your SMS open rate (67%) is 15% above industry average.
   Recommendation: Increase SMS frequency from 2x to 3x per week.
Projected impact: +12 additional qualified leads/month.- Human insight (not just data)
- Actionable recommendation
- Estimated impact in dollars/leads
- Purpose: Show client you’re paying attention and optimizing
Zone 7: Footer / Next Steps
📧 Questions? Reply to this snapshot or schedule a strategy call.
🔗 View full dashboard → [link to detailed analytics]
📅 Next update: June 25, 2026
How to Build Your First Client Snapshot Template
Step 1: Access the Snapshot Builder
In GoHighLevel:
- Go to Dashboard (home/main view)
- Look for “Client Snapshots” or “Reporting” section (location varies by plan)
- Click + New Snapshot or + New Template
- Name it:
"[Client Type] - Weekly Performance"(e.g., “Real Estate Agent - Weekly Performance”)
Step 2: Add a Header Section
- Click + Add Widget or + Add Section
- Select “Header” or “Custom Text”
- Enter:
[Insert Your Agency Logo Here] {Client Name} — Weekly Performance Report Period: {Start Date} to {End Date} - Add your agency logo (upload PNG/JPG, max 200px wide)
- Set background color to your brand color (or white for clean look)
Step 3: Add KPI Widgets
- Click + Add Widget
- Select “Metric” or “Stat Block”
- Configure each KPI:
KPI 1: New Leads
- Label: “New Leads (This Week)”
- Data source: Contacts created in last 7 days
- Value: Auto-calculated by GoHighLevel
- Trend: Show % change vs. last week (optional)
- Color: Green if trending up, yellow if flat, red if down
KPI 2: Conversion Rate
- Label: “Conversion Rate (30-Day)”
- Data source: (Closed deals ÷ total leads) × 100
- Value: Auto-calculated
- Benchmark: “Industry average: 3–5%” (shows you’re tracking)
KPI 3: Revenue (or Deal Value)
- Label: “Estimated Revenue (30-Day)”
- Data source: Sum of closed deal values
- Value: $XX,XXX
- Trend: % change vs. last month
Step 4: Add Your Primary Chart
- Click + Add Widget
- Select “Chart” → “Line Chart” or “Bar Chart”
- Configure:
- Title: “30-Day Lead Trend”
- X-Axis: Last 30 days (or last 4 weeks)
- Y-Axis: Lead count
- Data source: Contacts created each day/week
- Color: Your brand primary color
- Set chart height to medium (should take ~1/4 of screen)
Step 5: Add a Conversion Funnel or Breakdown
- Click + Add Widget
- Select “Chart” → “Funnel Chart” (if available) or “Bar Chart”
- Configure:
- Title: “Conversion Funnel (30-Day)”
- Stages: Lead → Qualified → Proposal → Closed
- Data source: Contacts in each pipeline stage
- Example:
Lead:       200 (100%)
Qualified:   80 (40%)
Proposal:    20 (10%)
Closed:       4 (2%)
Step 6: Add Engagement Metrics (Optional)
- Click + Add Widget
- Select “Text Block” or “Table”
- Add SMS/Email performance:
📊 COMMUNICATION METRICS (Last 30 Days)

SMS Performance:
• Open Rate: 67% (industry avg: 52%)
• Reply Rate: 18%
• Messages Sent: 245

Email Performance:
• Open Rate: 42% (industry avg: 35%)
• Click Rate: 8%
• Emails Sent: 189
Step 7: Add an Insight Callout
- Click + Add Widget
- Select “Alert” or “Highlight Box”
- Add actionable insight:
💡 INSIGHT: High SMS open rate indicates engaged audience.

Recommendation: Increase follow-up SMS from 2x to 3x per week
for qualified leads. Projected lift: +15 leads/month.
Step 8: Configure Branding
- Go to Snapshot Settings
- Upload your agency logo (100–200px)
- Set primary color (your brand color)
- Set secondary color (contrast color for callouts)
- Add footer text: “Questions? [Contact info]“
Step 9: Save & Test
- Click Save Template
- Click Preview to see how it looks
- Test with real data (use a test client account to verify calculations)
- Make adjustments and re-save
Template Examples: Ready-to-Deploy Snapshots
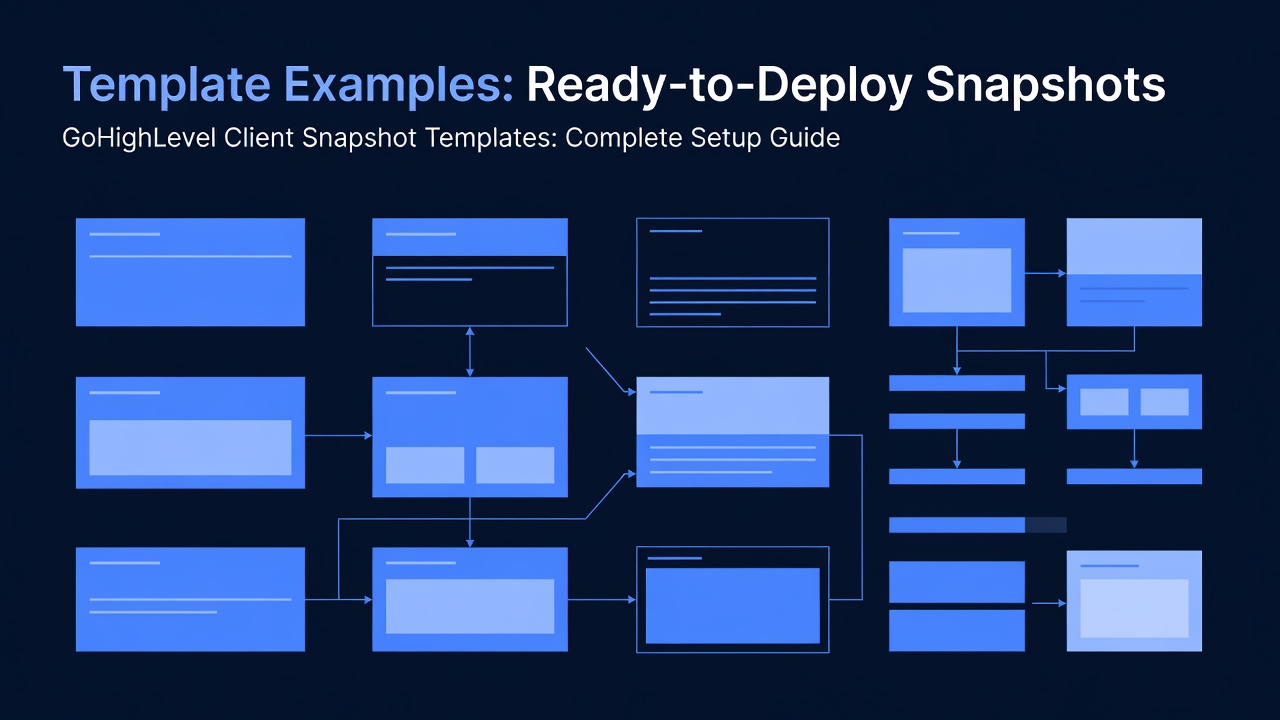
Template 1: Real Estate Agent (Sales-Focused)
Goal: Show lead volume, conversion rate, and revenue at a glance.
Widgets:
- Header: “Real Estate CRM — [Client Name]”
- KPI Row: New Leads | Conversions | Revenue
- Chart: 30-Day Lead Trend (line)
- Chart: Conversion Funnel (funnel)
- Engagement: SMS/Email open rates
- Insight: “Your SMS open rate is 15% above industry average”
- Footer: “Next update: June 25”
Time to first deploy: 15 minutes (using this template guide)
Template 2: Digital Marketing Agency (Traffic & Lead Quality)
Goal: Show website traffic → leads → conversions → revenue.
Widgets:
- Header: “Digital Marketing Dashboard — [Client Name]”
- KPI Row: Website Visitors | Leads Captured | Lead Quality Score | Revenue
- Chart: Traffic vs. Leads (dual-axis line chart)
- Chart: Lead Source Breakdown (pie or bar)
- Chart: Lead Quality by Source (table)
- Engagement: Campaign performance (email/SMS)
- Insight: “Top source: Organic search (47% of leads). Recommendation: Increase organic budget.”
- Footer: “View full analytics → [link]”
Time to first deploy: 20 minutes
Template 3: B2B SaaS Sales Team (Pipeline & Revenue Forecast)
Goal: Show pipeline health, deal movement, and revenue forecast.
Widgets:
- Header: “Sales Pipeline — [Client Name]”
- KPI Row: Pipeline Value | Deals in Progress | Win Rate | Avg. Deal Size
- Chart: Pipeline by Stage (bar)
- Chart: Deal Movement (30-day, showing velocity)
- Table: Top 5 Deals (name, value, stage, days in stage)
- Insight: “Deals staying in Proposal 40% longer than average. Recommendation: Add proposal review step to reduce decision time.”
- Footer: “Sales manager: [Name] | Questions: [Contact]”
Time to first deploy: 25 minutes
Template 4: Fitness Coaching Studio (Member Metrics & Revenue)
Goal: Show member acquisition, retention, and revenue per member.
Widgets:
- Header: “Fitness Studio Dashboard — [Client Name]”
- KPI Row: New Members | Member Retention | Monthly Revenue | Avg. Lifetime Value
- Chart: Member Acquisition (30-day trend)
- Chart: Revenue by Program (pie)
- Engagement: Email campaign performance (class reminders, promotions)
- Insight: “Members who receive 3+ reminders/week have 25% lower churn. Increase reminder frequency.”
- Footer: “Retention rate: 92% (goal: 95%)”
Time to first deploy: 15 minutes
Best Practices: Making Snapshots Client-Winning
Best Practice 1: Metric-First Design
Put the most important number above the fold (visible without scrolling).
- Real estate agent: leads captured
- B2B SaaS: pipeline value
- Fitness studio: new members + retention
Example: A real estate agent shouldn’t scroll to see “How many leads did I get?” That should be the first thing visible.
Best Practice 2: Color-Code Performance
Use traffic-light colors (green, yellow, red) to make performance instantly clear:
- Green: 10%+ growth or above-target KPI
- Yellow: Flat or slightly below target
- Red: 10%+ decline or below-target KPI
📊 New Leads: 45 [GREEN] ↑ 12% vs. last week
📞 Calls Made: 12 [YELLOW] ↔ 0% vs. last week (should be 20+)
💰 Revenue: $36K [GREEN] ↑ 8% vs. last week
A client sees red anywhere and immediately knows to take action.
Best Practice 3: Compare to Benchmarks or Goals
Show how the client is performing vs. their goal or industry standard:
Conversion Rate: 2.1%
├─ Your goal: 3%
└─ Industry average: 2.5%
Status: [YELLOW] Slightly below goal, but on par with industry
This context tells the client their performance matters.
Best Practice 4: Include a Trend Chart (Not Just Numbers)
A trend chart shows momentum (are we going up or down?). Numbers alone don’t tell the story:
Without trend: "Lead count: 45"
(Client: Is 45 good? Bad? No context.)

With trend: "Lead count: 45 ↑ 12%"
(Client: 45 is good and trending better!)

With trend chart: [Chart showing lead trend over last 30 days]
(Client: Sees the exact pattern, understands what's working)
Best Practice 5: One Actionable Insight per Snapshot
Add a human insight that shows you’re optimizing, not just reporting:
💡 INSIGHT: Your email open rate (42%) is below industry average (47%).
   Likely cause: Subject lines are too generic.
   Recommendation: Test personalized subject lines (add {first_name}).
   Projected impact: +5 percentage points = +8 additional qualified leads.
This insight is worth gold. Client thinks: “This agency isn’t just managing my CRM; they’re actively optimizing it.”
Best Practice 6: Avoid Snapshot Bloat
Don’t add 15 widgets thinking “more data is better.” A cluttered snapshot is ignored.
Rule: Max 7 widgets per snapshot view. If you have more data, add a second page or link to detailed analytics.
❌ CLUTTERED (8+ widgets):
- 10 KPI rows
- 4 charts
- 3 data tables
- 2 text callouts
→ Client is overwhelmed, doesn't know what to focus on

✅ CLEAN (5-7 widgets):
- 3 KPI rows (most important)
- 2 charts (trend + breakdown)
- 1 insight callout
- 1 footer/next steps
→ Client sees performance at a glance, understands what's working
Best Practice 7: Update Snapshots Weekly (Set a Cadence)
A snapshot is only valuable if it’s current. Stale data loses credibility.
Weekly cadence:
- Monday 8 AM: Snapshot updates with weekend + Friday data
- Client logs in, sees fresh metrics
- Client thinks: “This agency is on top of things”
How to automate: If GoHighLevel supports scheduled snapshots, set it. Otherwise, add it to your Monday morning routine (5 minutes per client if templates are standardized).
Reusing Templates Across Clients: The Time Saver
The real power of snapshots is template reuse. Build once, deploy 50 times.
Scenario: You Have 20 Real Estate Agent Clients
Without templates:
- Design 20 individual snapshots = 15 min × 20 = 5 hours
- Update each weekly = 5 min × 20 = 100 hours/year
With one template:
- Design 1 template = 15 minutes
- Deploy to 20 clients (1 min per client) = 20 minutes
- Update template once, auto-applies to all 20 = 5 minutes/week
- Time saved: 4.8 hours first week + 99 hours/year = 104 hours/year saved
At $100/hour billed time, that’s $10,400 in recovered capacity per year per template type.
How to Deploy a Template to Multiple Clients
- Build your template (as described above)
- In GoHighLevel, go to Snapshots → My Templates
- Select your template
- Click “Duplicate” or “Apply to Client”
- For each client account:
- Select the client
- Apply template
- Customize client name + logo (if different)
- Save
- Repeat for all clients (bulk apply if GoHighLevel supports it)
Advanced: Custom Metrics & API Integration
If you’re comfortable with GoHighLevel’s API, you can add custom calculations:
Example: Lifetime Value (LTV) Calculation
Most CRMs don’t auto-calculate LTV. You can add it to a snapshot via API:
LTV = (Average Deal Value) × (Repeat Purchase Rate) × (Average Customer Lifespan)

Example: Real Estate Agent
- Avg. deal value: $11,250 (2.5% commission on $450K home)
- Repeat rate: 15% (clients refer or sell again)
- Lifespan: 5 years (assuming client stays engaged)
- LTV = $11,250 × 0.15 × 5 = $8,437

Display on snapshot: "Client Lifetime Value: $8,437"
This requires:
- GoHighLevel API knowledge
- Custom script or Zapier workflow
- 1–2 hours setup per custom metric
Worth it? If you’re reselling to 50+ clients, custom metrics become a competitive advantage.
Troubleshooting: Common Snapshot Issues
Issue 1: Data Not Updating
Problem: Snapshot shows yesterday’s data, not today’s.
Solution:
- Check GoHighLevel’s data sync (should be 2–4 hour delay)
- Confirm the data source (is it pulling from the right pipeline/contact list?)
- If manual data entry: add to your weekly update routine
Issue 2: Chart Says “No Data Available”
Problem: A chart widget shows blank instead of data.
Causes:
- Chart is configured to look for data that doesn’t exist (e.g., “conversions” in a contact list with no closed deals)
- Date range is wrong (looking for last 30 days of data when the client has only been live 5 days)
- Data source permission issue (snapshot can’t access certain fields)
Solution:
- Verify data exists first (manually check the pipeline/contact list)
- Adjust the chart’s date range to match client’s onboarding date
- Check snapshot permissions in GoHighLevel settings
Issue 3: Snapshot Takes Too Long to Load
Problem: Snapshot has 10+ widgets and takes 30+ seconds to load.
Solution:
- Delete unnecessary widgets (see “Avoid Snapshot Bloat” best practice)
- Split into two snapshots (main dashboard + detailed analytics)
- Reduce chart data range (show last 30 days instead of last 365)
FAQ: Client Snapshots
Q: Can clients edit their snapshot?
A: Typically no. Clients view only; you control the snapshot design. This prevents accidental deletion/breakage.
Q: Do snapshots work on mobile?
A: Yes. GoHighLevel optimizes snapshots for mobile (responsive design). A client can view on phone and see key metrics.
Q: Can I add a snapshot to an email instead of in-app?
A: You can export a snapshot as an image/PDF and email it weekly. This requires manual export, but some agencies do this for added touchpoint.
Q: What if a client wants a different layout?
A: Create a new snapshot variant (e.g., “Real Estate Agent - Detailed” for clients who want more data). Most agencies maintain 2–3 variants per client type.
Q: Can I use snapshots for internal reporting (not client-facing)?
A: Yes. You can create internal snapshots showing all your clients’ performance (aggregate view). Useful for your own agency dashboard.
Q: Do I need Pro or Unlimited plan for snapshots?
A: Yes. Snapshots are a Pro+ feature. Starter plan doesn’t include snapshots.
Next Steps: Build Your First Snapshot
- Choose your client type (real estate, digital agency, SaaS, fitness, etc.)
- Select which template above matches your business
- Log into GoHighLevel → go to Snapshots section
- Follow steps 1–9 from the “How to Build Your First Client Snapshot Template” section above
- Set your brand colors and logo
- Preview the snapshot with test data
- Deploy to your first 3 pilot clients (get feedback)
- Refine based on feedback (move widgets, adjust colors, reword insights)
- Duplicate the template to your remaining clients
- Set a weekly update cadence (Monday morning refresh)
Internal Linking & Related Resources
- GoHighLevel Pipelines & Automation — Learn how pipelines feed data into snapshots
- GoHighLevel Pricing Plans — Pro plan includes snapshots
- GoHighLevel White-Label Setup — Full white-label agency guide (includes snapshot branding)
- GoHighLevel Reporting & Analytics — Export full reports beyond snapshots
Affiliate Disclosure
Short n Sweet Digital is a GoHighLevel white-label partner. We earn commissions on qualified signups through our affiliate link at https://www.gohighlevel.com/?fp_ref=shortnsweet53 at no cost to you. All features, pricing, and plans referenced in this article are current as of June 2026 and subject to change. Check GoHighLevel’s official site for the latest details.
━━━━━━━━━━━━━━━━━━━━━━━━━━━━━━━━━━━━━━━━━━━━━━━━━━━━━━━━━━ Built by agricidaniel - Join the AI Marketing Hub community 🆓 Free → https://www.skool.com/ai-marketing-hub ⚡ Pro → https://www.skool.com/ai-marketing-hub-pro ━━━━━━━━━━━━━━━━━━━━━━━━━━━━━━━━━━━━━━━━━━━━━━━━━━━━━━━━━━